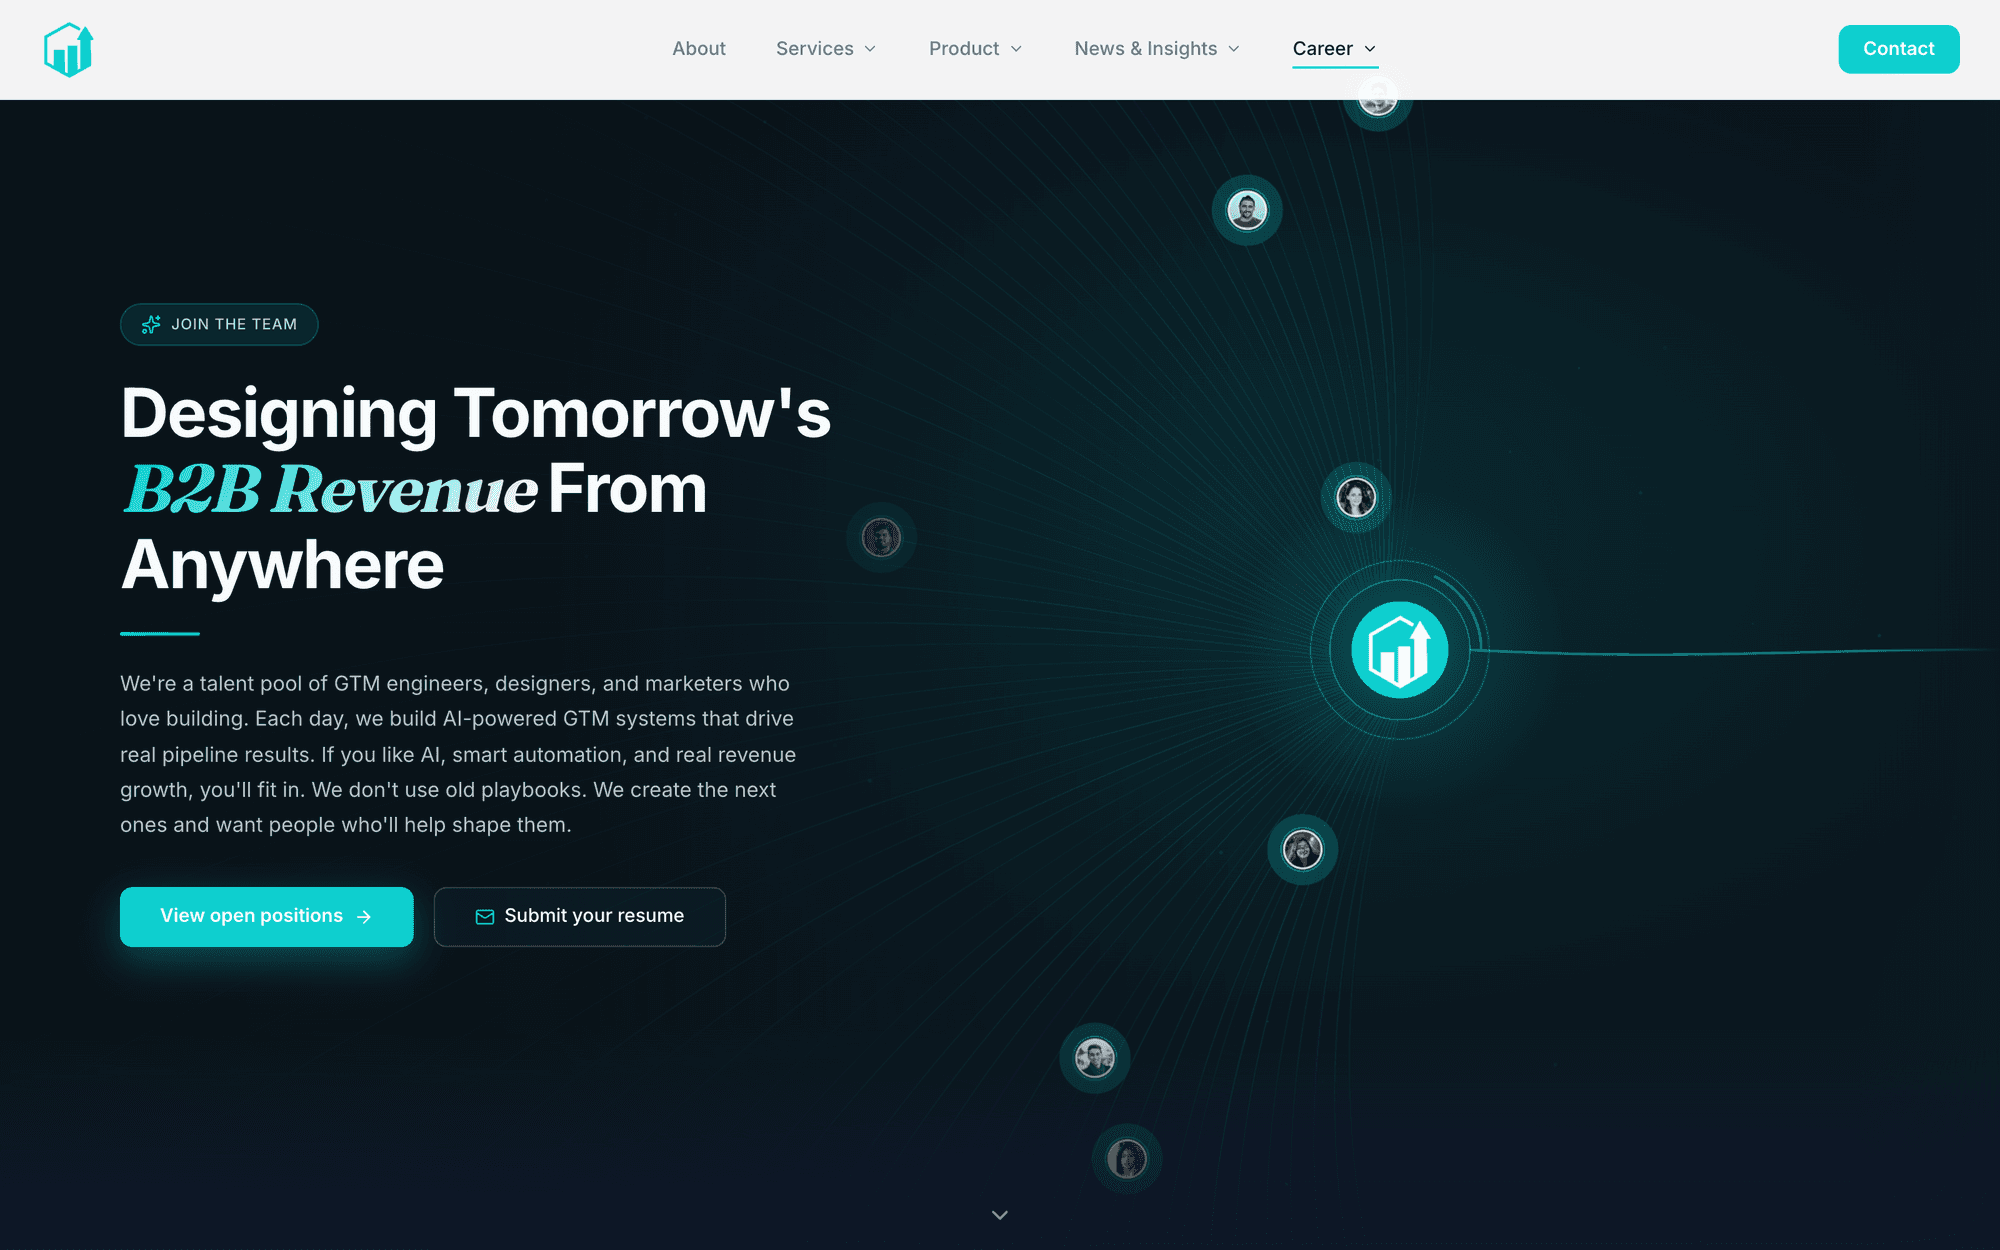
The live site for a B2B AI go-to-market platform: I designed the interface and shipped the production front-end, turning dense intent-signal and GTM-automation ideas into a clean, fast, high-contrast experience.
Everything else on this site is a labelled prototype. This one isn't: it's a real B2B SaaS marketing site, live in production right now, and I designed the interface and wrote the front-end code that ships it. InsightsTap sells 'intent signals' to go-to-market teams (reading anonymous buyer behaviour before a prospect ever fills out a form), which means the entire product lives in concepts nobody can point at. There's no physical object to photograph. The site had to make an invisible product feel as concrete and fast as the e-commerce tools it compares itself to.
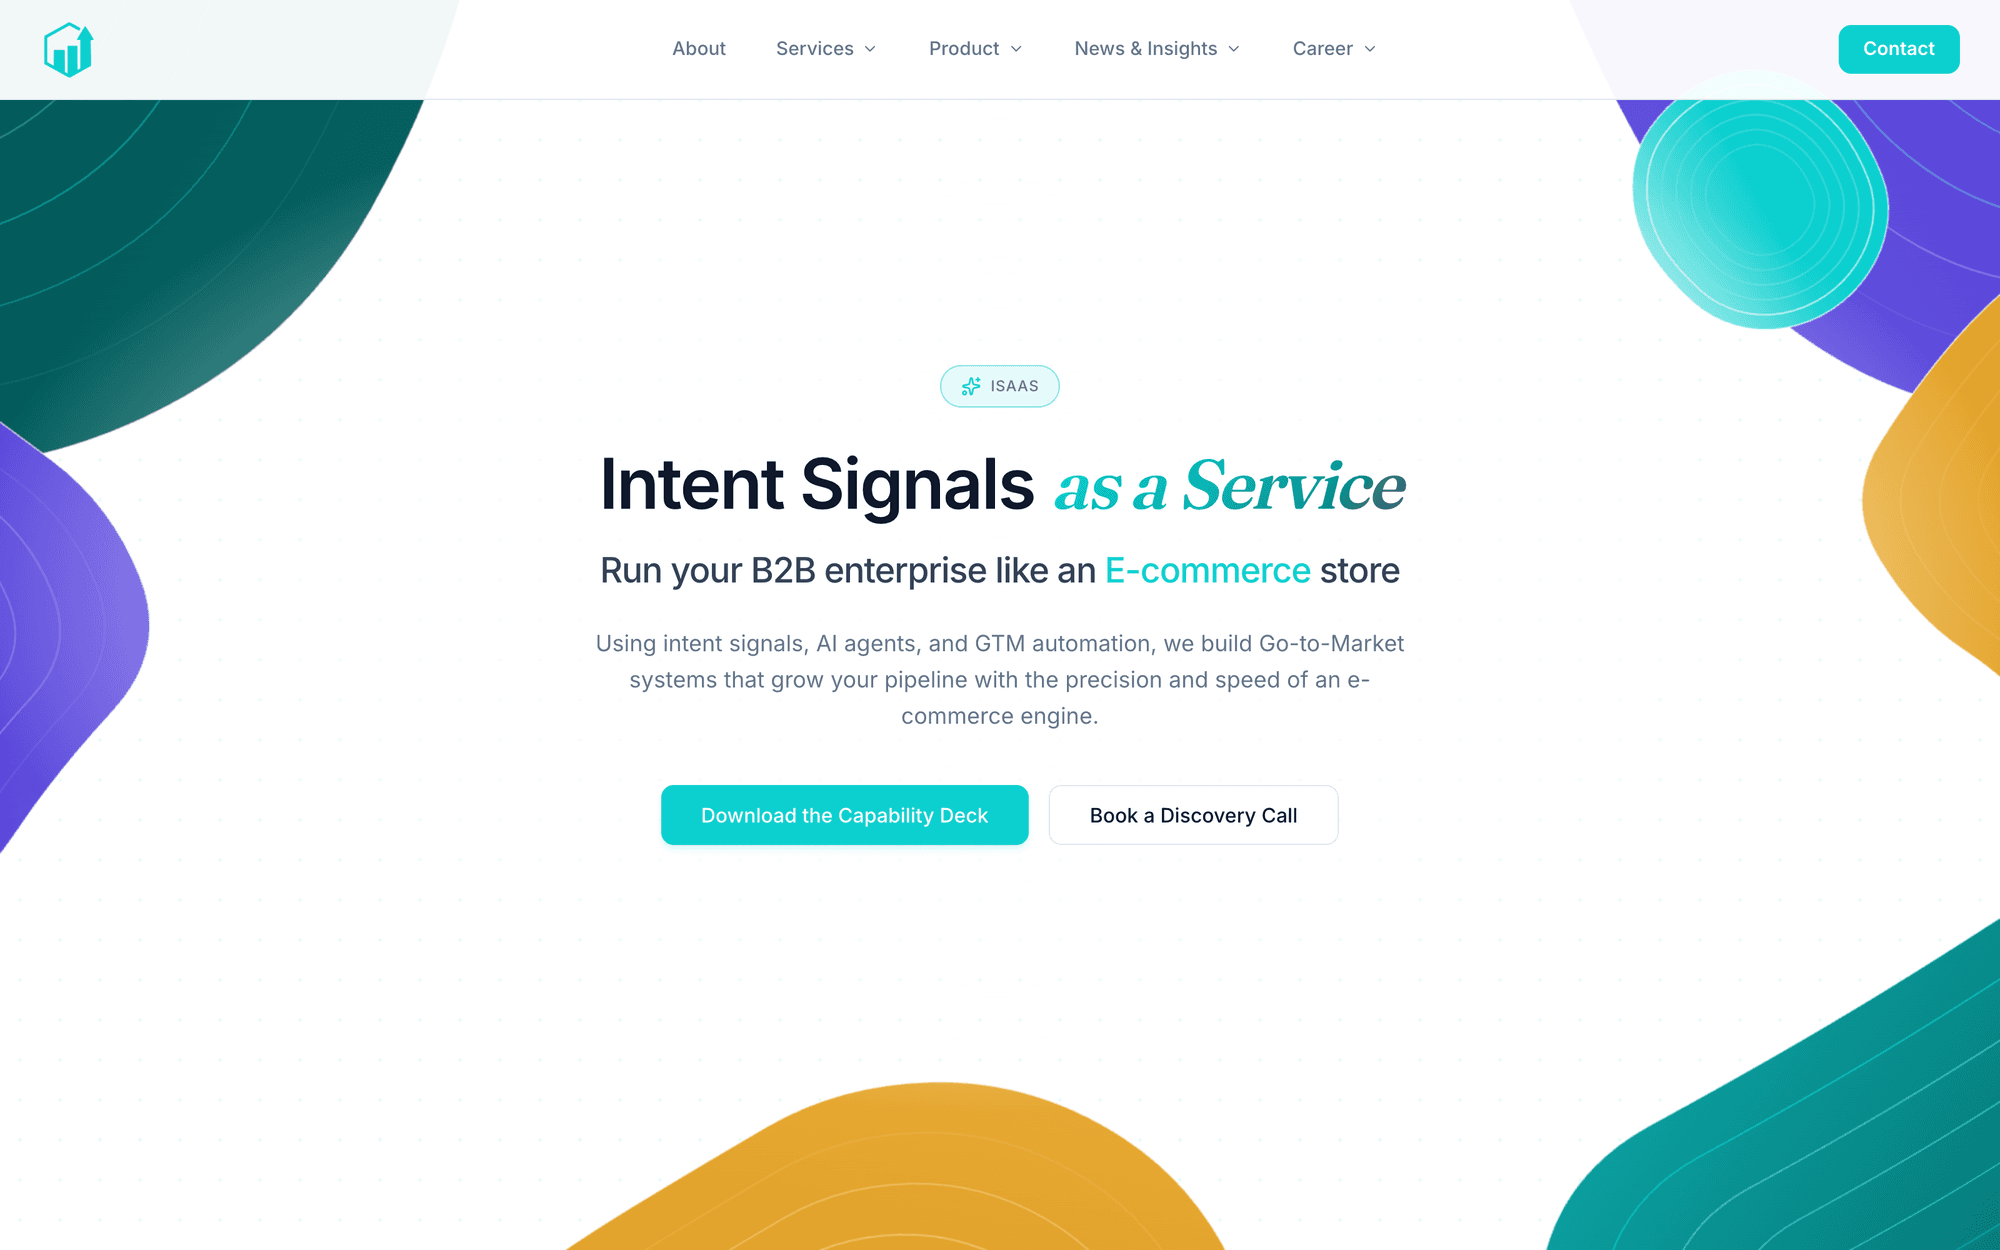
InsightsTap's own pitch leans on one comparison (run your B2B enterprise like an e-commerce store), and I anchored the entire site on it instead of introducing a competing metaphor of my own. Buyers in this category research anonymously and decide fast, so giving them a mental model to borrow in the first five seconds mattered more than being original. Every section after the hero pays that metaphor off rather than switching frames halfway through.
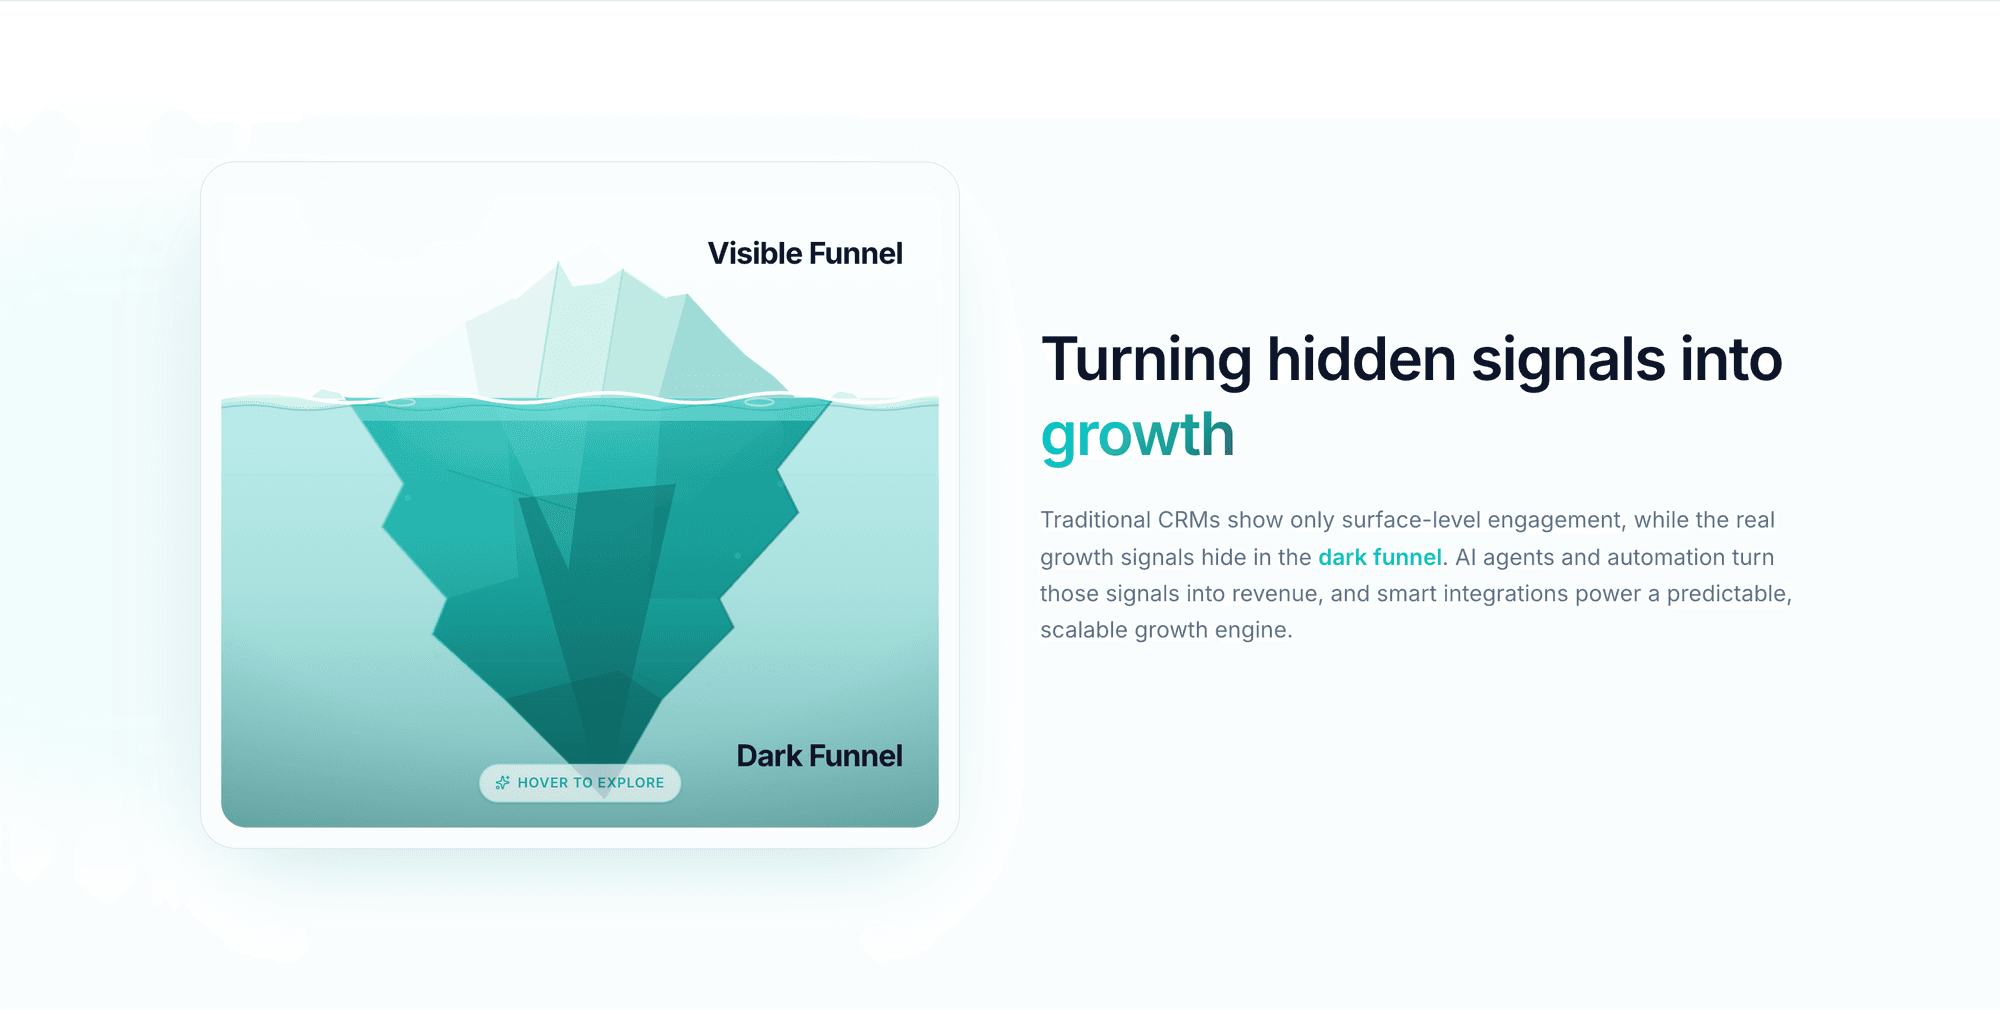
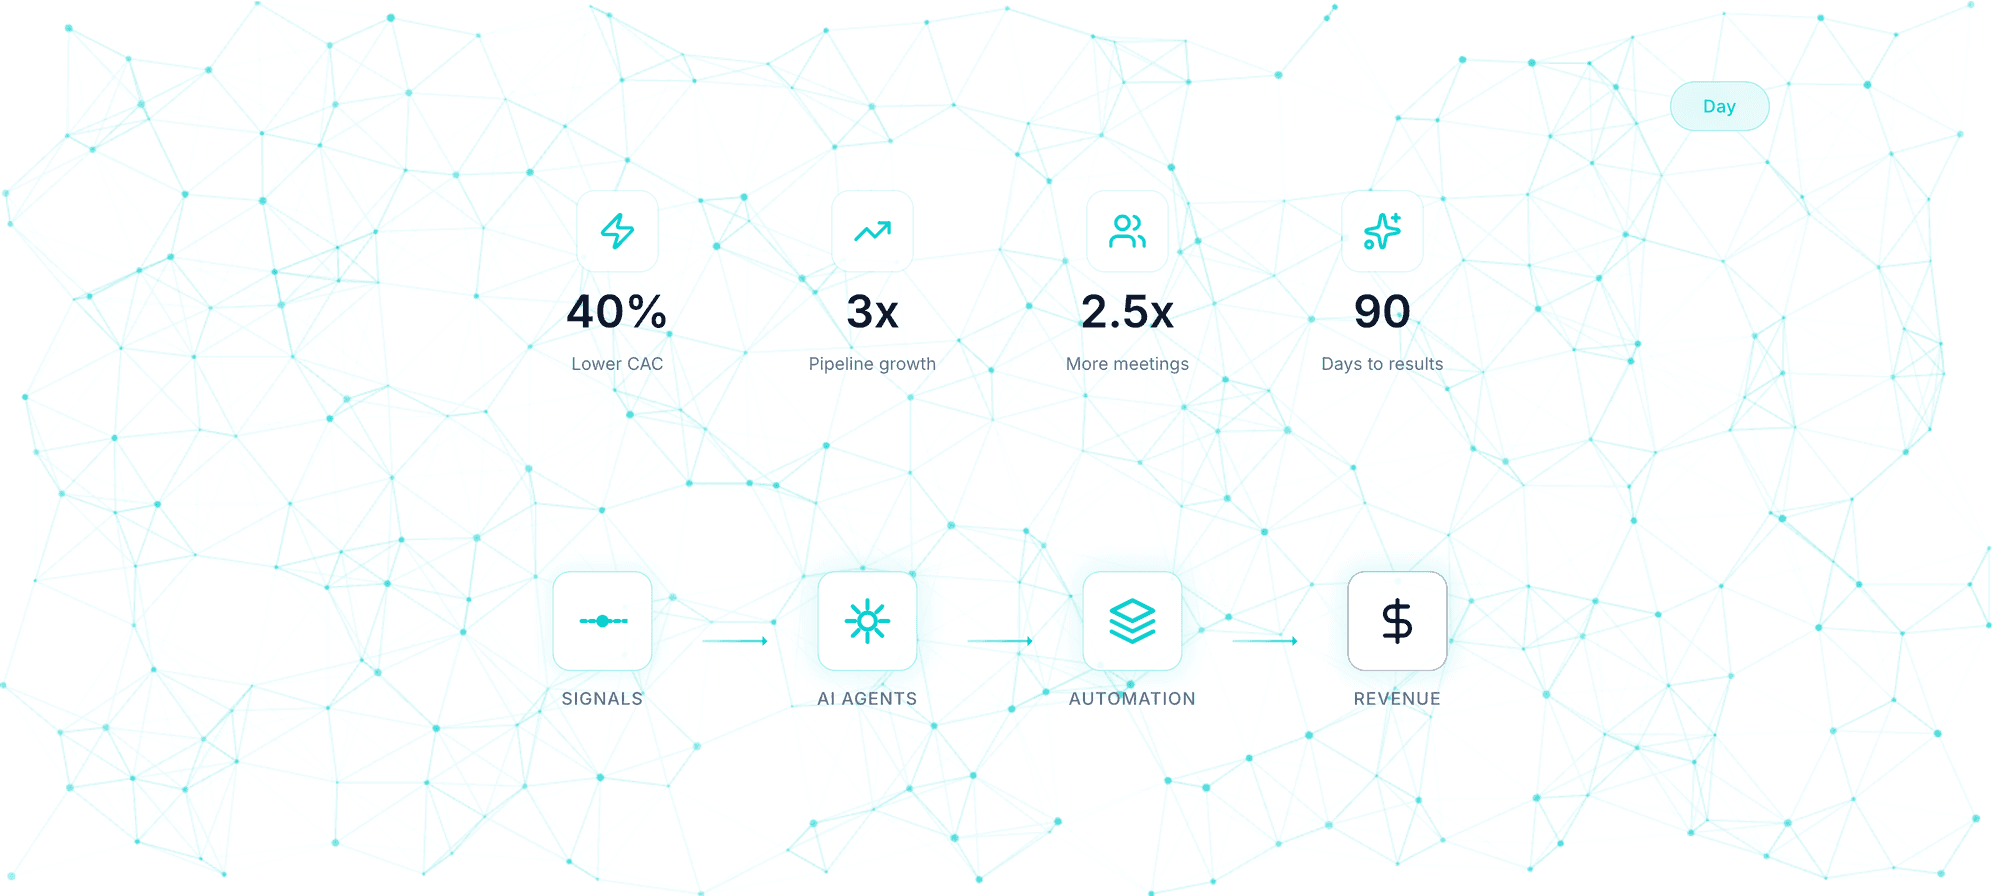
The incumbents here (6sense, Demandbase, ZoomInfo, Bombora) all compete on density: walls of stats, huge signal-volume numbers, full-stack capability lists. Against that, one calm, high-contrast component system that keeps the heaviest data sections legible isn't just a style choice, it's the differentiator. One vocabulary of cards, bands and diagrams runs through the whole site, so even the densest metrics section costs a returning reader nothing new to learn.
The parts of this build I am proudest of have no screenshot. The code is InsightsTap's, so none of it is on this page; what it does is mine to describe.
Which is what makes the next number annoying rather than surprising. Every rule above is about not spending a visitor's bandwidth, and the hero video breaks all of them.
I'd rather tell you this than let you find it: mobile load time on the live site currently sits around 14 seconds, because the hero video is the largest content element on the page. A poster-first loading fix is queued; I'm choosing to publish the honest number instead of hiding it until it's solved. Everything else is already where it needs to be: layout shift sits at a median 0.00 across five Lighthouse runs, and mobile accessibility scores 95.
This is the mechanism behind How measured. InsightsTap is a client codebase and none of it appears here. What is mine is the measurement: a script in this portfolio's own repo that runs Lighthouse against the live URL five times in each mode and reports the median of every figure it quotes.
const PAGES = [["home", "https://insightstap.com/"]];const RUNS = process.argv.includes("--quick") ? 1 : 5;const MODES = ["mobile", "desktop"];const median = (xs) => { const s = [...xs].sort((a, b) => a - b); return s[Math.floor(s.length / 2)];};// … each run shells out to Lighthouse against the live URL and keeps the// report JSON, then reads the scores and the web vitals out of it. results[`${name}-${mode}`] = { perf: median(runs.map((r) => r.perf)), a11y: median(runs.map((r) => r.a11y)), bp: median(runs.map((r) => r.bp)), seo: median(runs.map((r) => r.seo)), lcp: median(runs.map((r) => r.lcp)), cls: median(runs.map((r) => r.cls)), tbt: median(runs.map((r) => r.tbt)), fcp: median(runs.map((r) => r.fcp)), runs: RUNS, };A single Lighthouse run is noisy enough that you can have whichever number you want if you are willing to run it until one flatters you. Nobody would catch it, which is exactly why it needs a rule rather than good intentions. Five runs and a median is the cheapest defence I know against quoting my own best result, and the part that matters is that it applies to every figure equally. The uncomfortable number on this page, the mobile load time, was arrived at by the same method as the flattering one.
node scripts/lighthouse-insightstap.mjs writes one JSON report per run and prints the medians. The reports stay out of the repo because they are close to a megabyte each, so the provenance lives on the machine that ran it rather than in the published site. It measures the live site as it is today, which means it will report today's numbers and not the July 2026 ones quoted above.
Portfolio code · measures the live site
Because I designed and built the same site, nothing needed specifying twice: motion, empty states, focus order, and what happens at 320 pixels wide never got lost in a handoff, because there wasn't one. Given more time, I'd push the heaviest data sections further with motion that reveals the cause-and-effect story step by step, and test the current four-step narrative against how real buyers actually scan the page, not how the category assumes they do.